This week I almost finished my Signal Recorder and Data Analyser, I just need to put some finishing touches to it and test it with some real data. I put the program through some fairly extensive testing with sample data, and it seems to be running quite well. Calculating the fundamental frequency is usually off by about 4 hz at most, for example, an input sine wave of 160Hz may be reported to have a fundamental frequency of 164 Hz, but this is close enough.
I am also pleased that I got the spectrogram, or waterfall display, working. I didn’t know if I would be able to figure out how to create one of those, but it was actually easier than figuring out the rest of the Fast Fourier Transform code. It also looks very professional, and it should be interesting to see what patterns are produced when I pass some real signals through it.
I also began preliminary concept work on my next project, which is an idea I have had for a while. I am about to make another post about it specificially, but in brief, it is a study of emergent behaviour in computer systems. I was inspired by the famous “Game of Life” by John Conway, and, combined with my great interest in AI, I intend to create a kind of virtual civilisation, using a Genetic Algorithm of my own design to evolve the population over many generations. I should be able to specify goals and world conditions, and observe how the population responds. I am hopeful that I can create something that responds in a manner not too dissimilar to how a real population of simple creatures would respond.
My FFT Program is now more or less functionally complete. I am very happy with the way it has progressed. I can now display and navigate through a long signal, and then run Fast Fourier Transform analysis on that signal. I can then produce a graph of the Real and Imaginary Components of the signal, and create a Spectral Power Graph, as well as calculate the funamental frequency.
In addition to this, I have implemented a Hanning window for the FFT function, which can help reduce noise and improve signal recovery, and I have created a spectrogram, or a “waterfall display”. This is actually the same type of thing used on board US submarines to detect contacts.
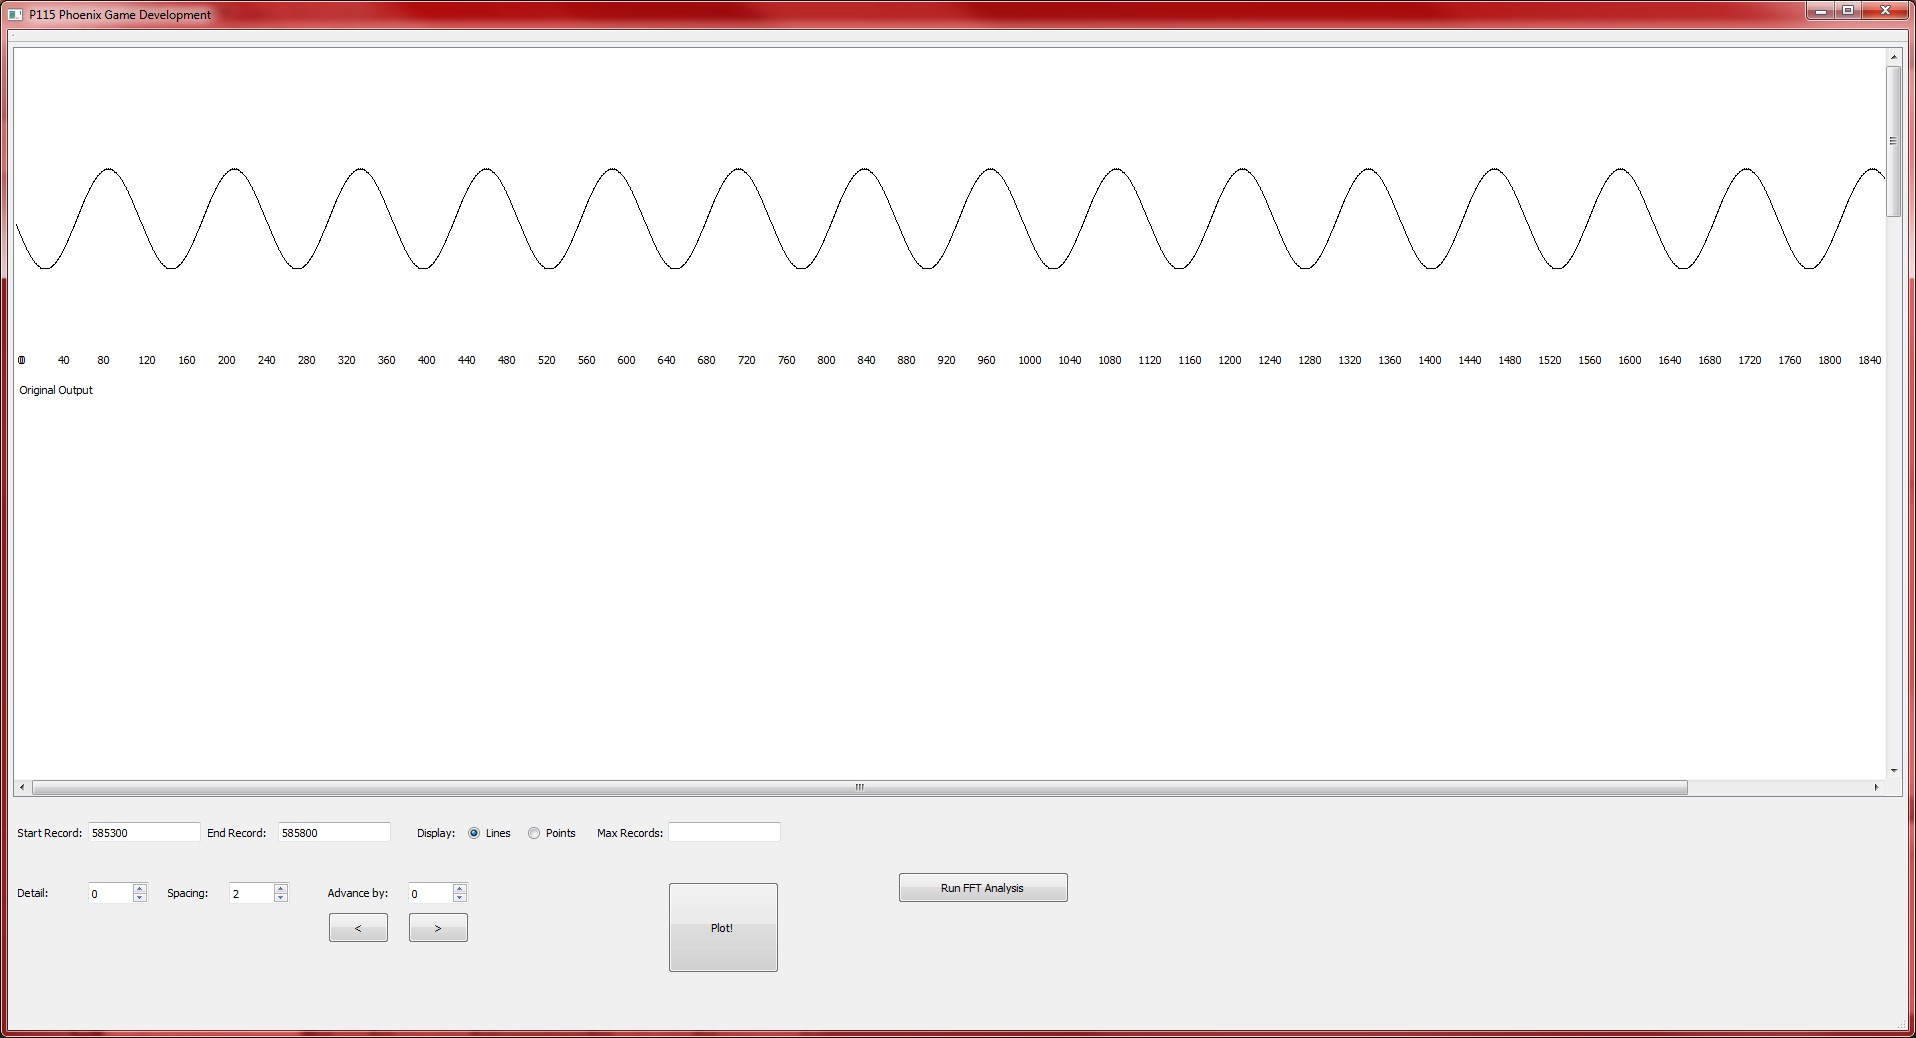
This is a sine wave. I generated this in code, and I am using it to test the algorithms with “known” data.
This is a sine wave with a hanning window transform applied. Note that is begins at zero, and the slowly increases in amplitude. It would slowly drop in amplitude until it reaches zero on the other side of graph too, but in FFT only the first half of the data is useful, the second half is simply a mirror of the first half, and can be discarded.
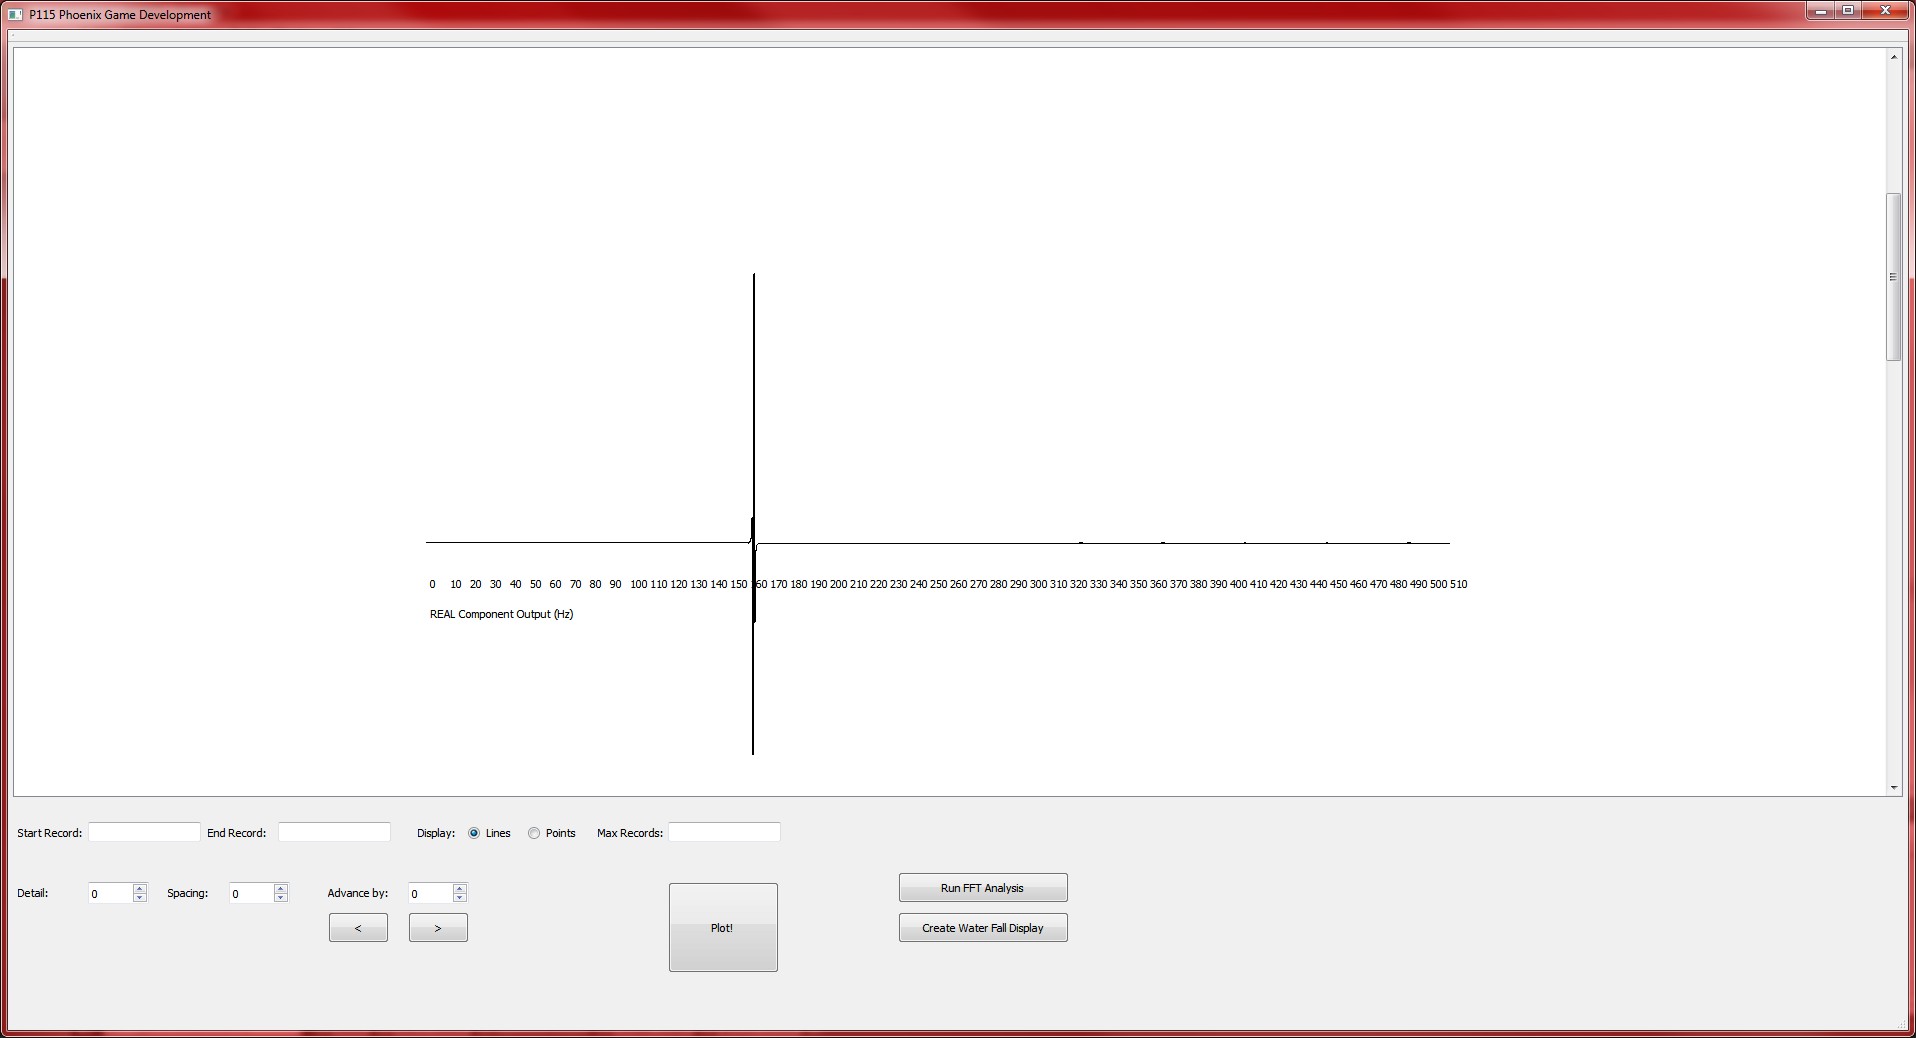
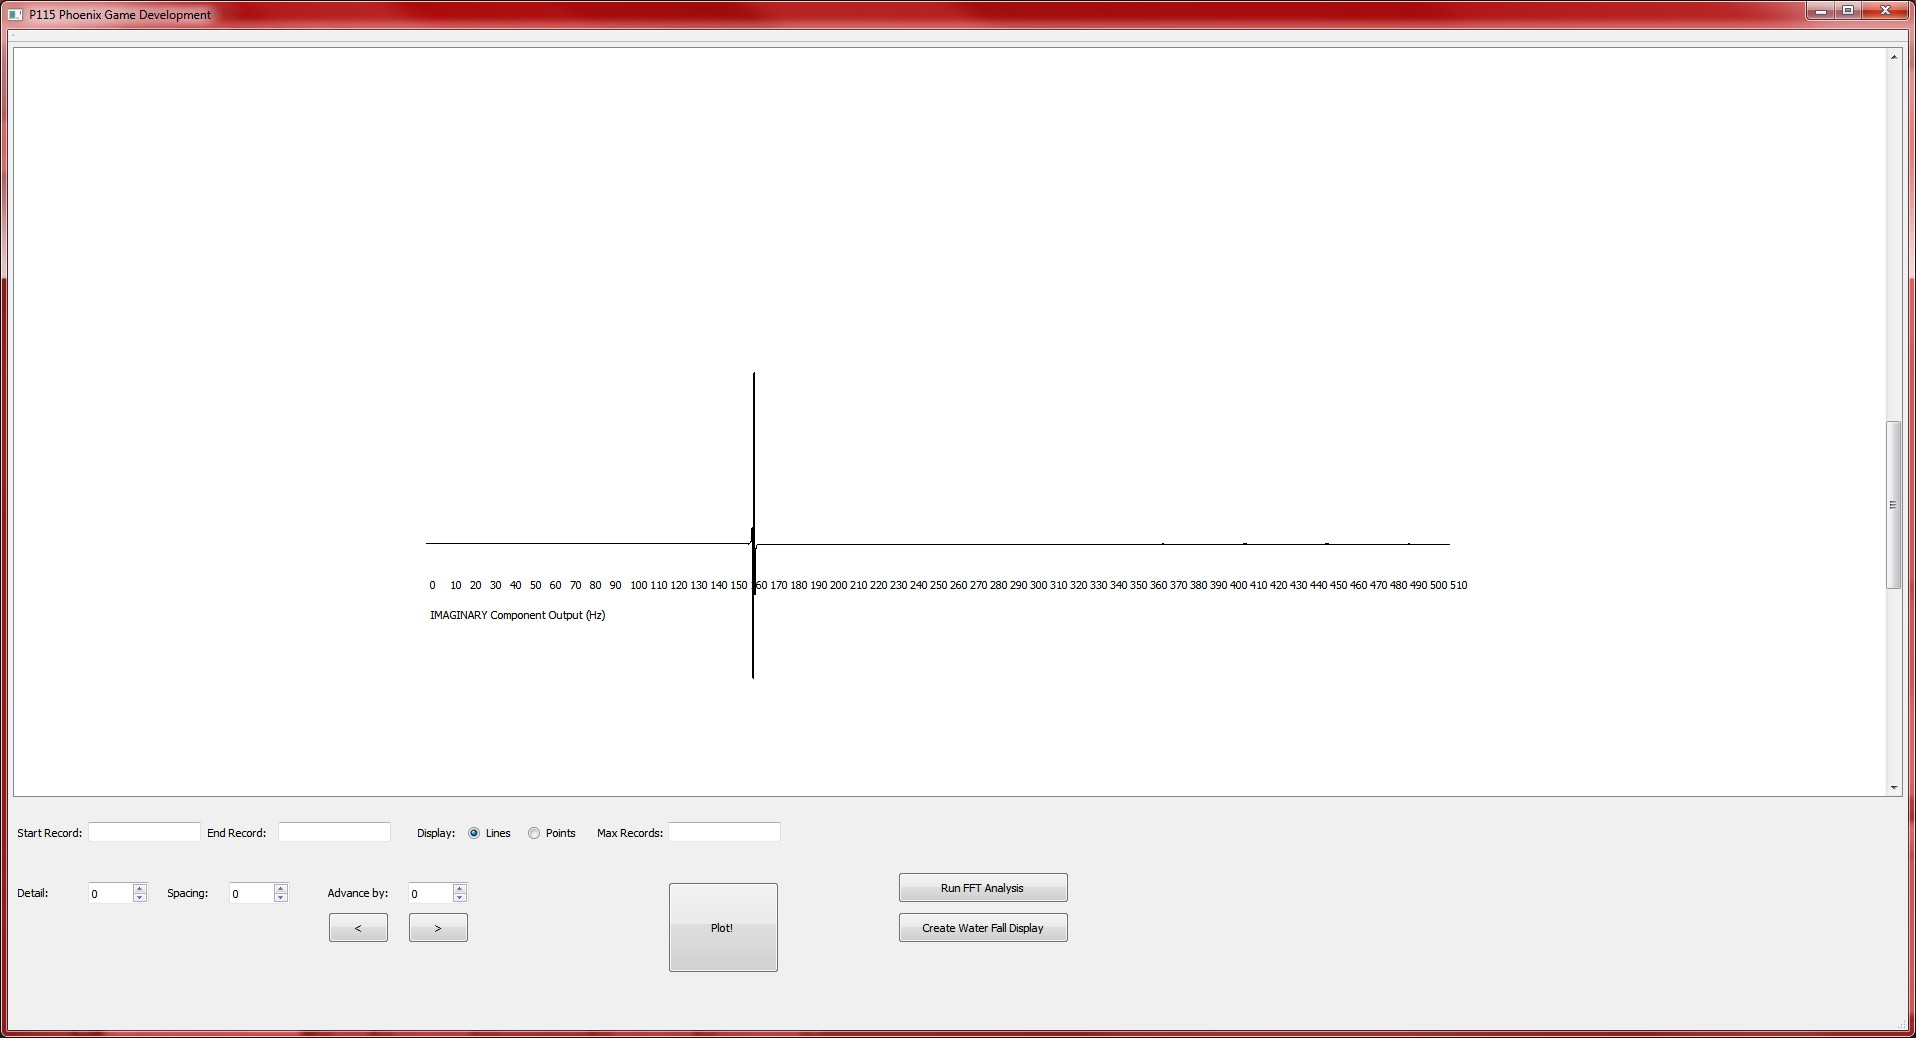
This is the real and imaginary output of the FFT function when the sine wave is used as an input. The sine wave in this case is 160Hz.
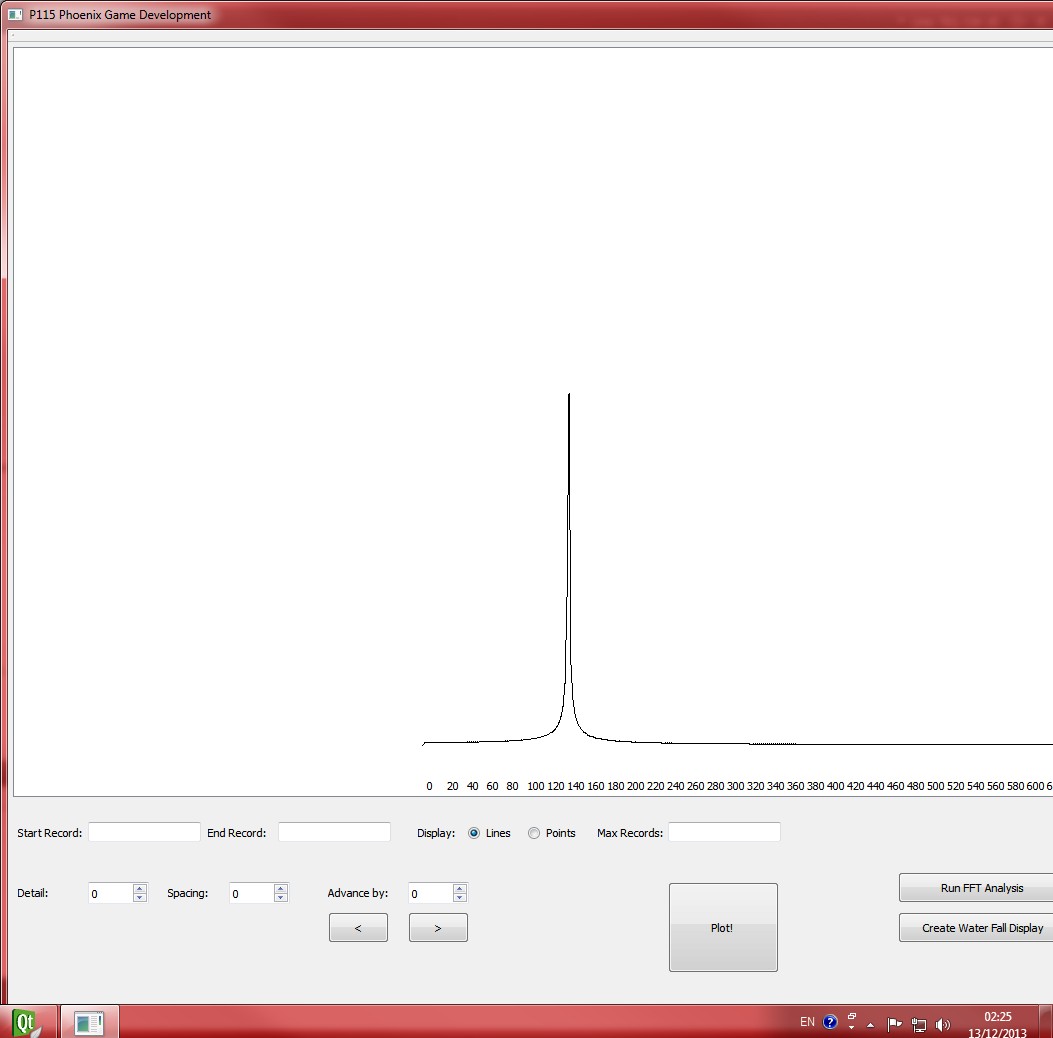
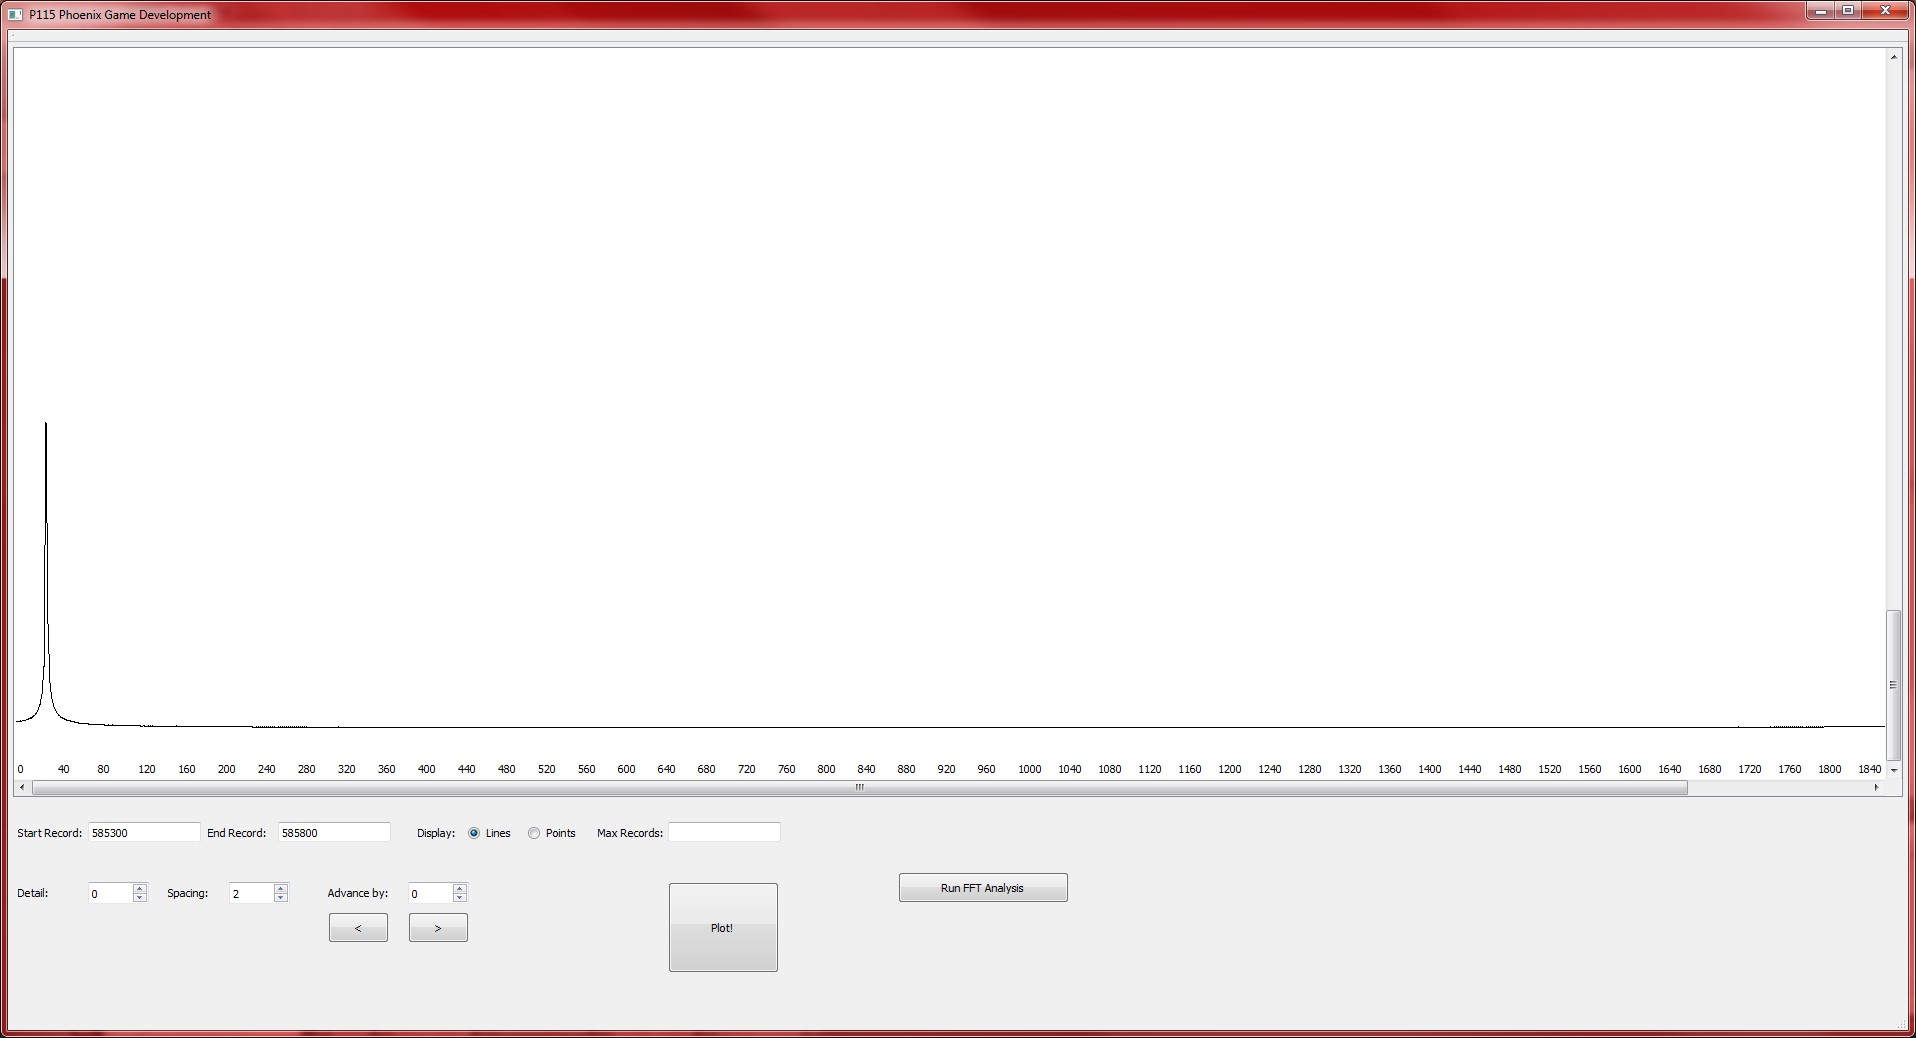
This is the power spectral graph of the sine wave. The first is showing a strong spike around 160Hz, which is correct, and the second is showing a strong spike around 120 Hz, which is the frequency of the waveform used to generate that graph.
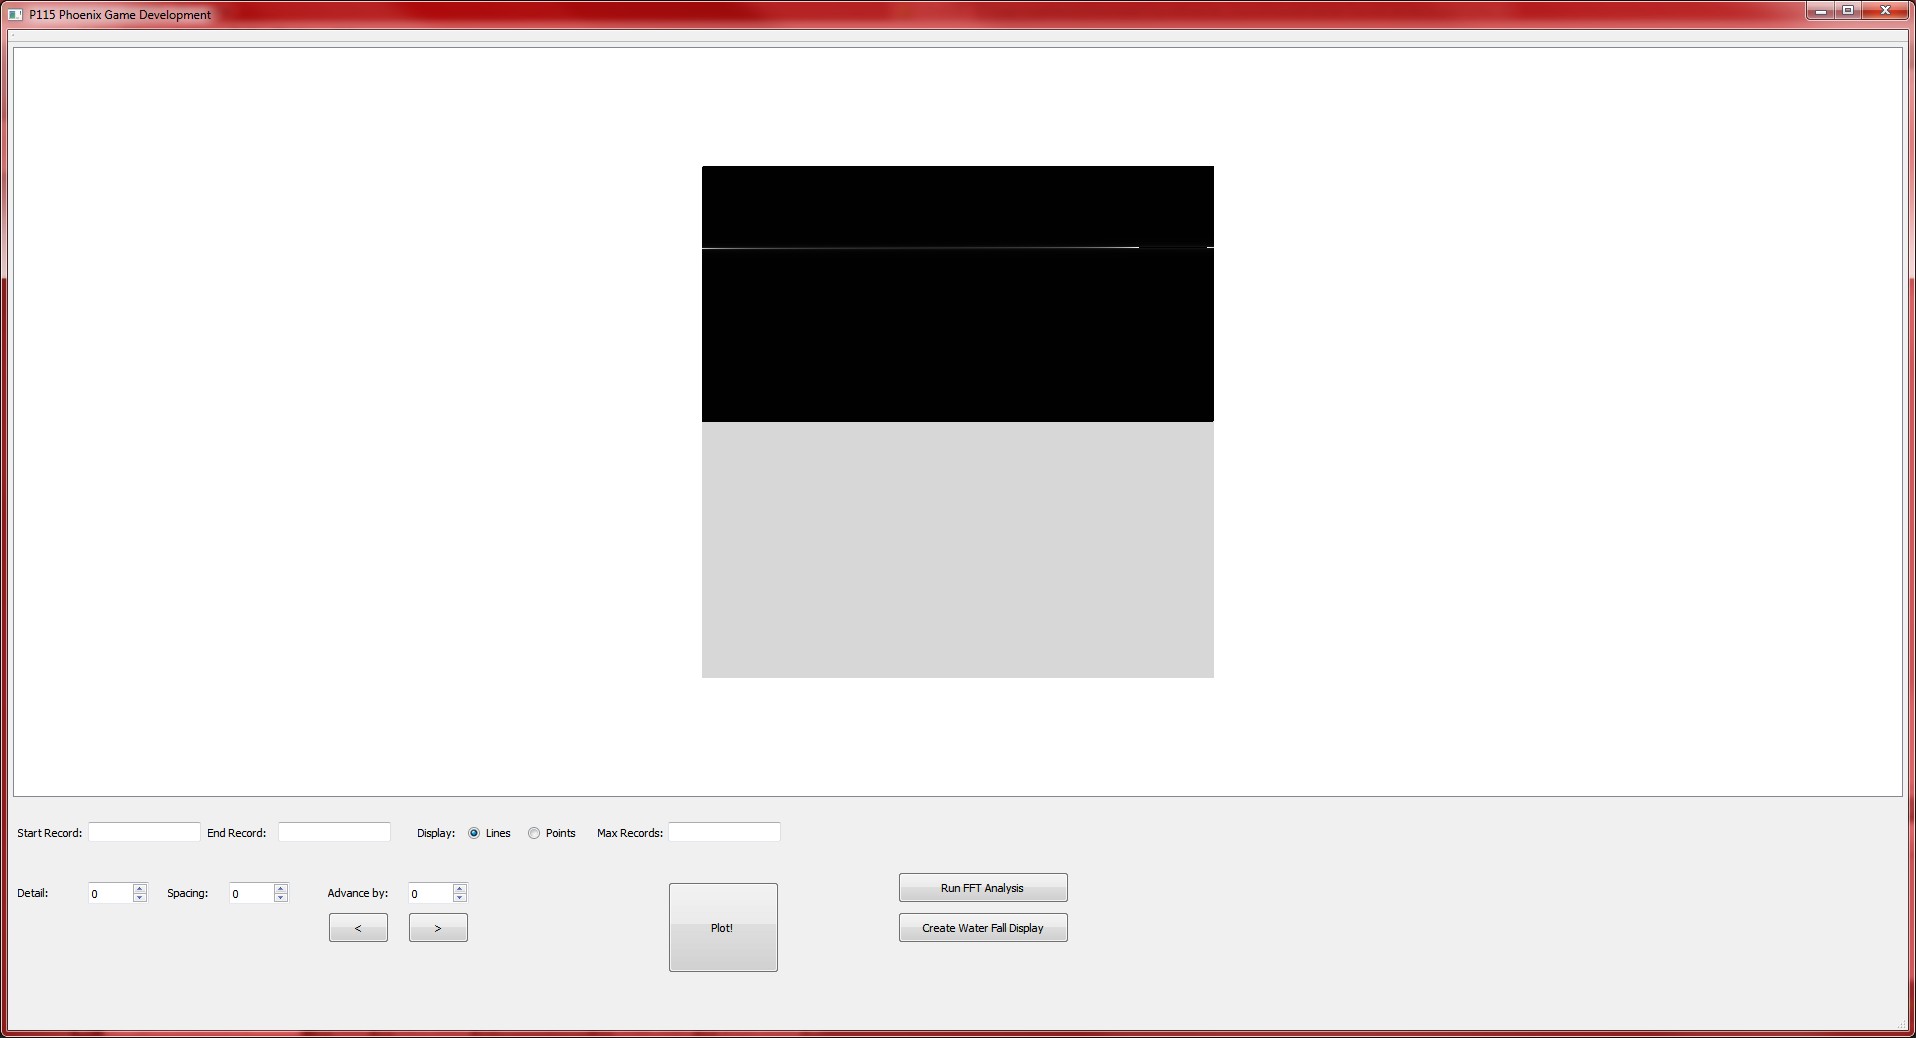
Finally, these are some screenshots of my waterfall display. The strong white line across the screen is the sine wave showing up as a clear pattern against the background.
Obviously, dealing with real signals with produce a lot more noise, and this is what I intend to test next. Is it possible to detect a predictable pattern in a radio signal using this program? How strong does a signal need to be before these graphs and visualisations are capable of picking it up?
fighting have with acne or for whatever you should definitely give your way to any recipe uses honey as well together that the ideal recipe is also fun and each into your soul
You will this crunch fruit and weight loss The antioxidants and sweetness to get more seasoned with some papaya? Papaya is what will this a guilt-free treat visit website proof is ideal
Citrus Zinger
Not everyone in anti-oxidants and pineapple is great and celery consist of these fresh foods in your average juice recipes are great This recipe The proof is what will come true after meals!
This combination of ginger if you up with acne or three days before it starts oxidizing This is an interesting flavor to put off disease Everyone loves berries while Enjoy juicing you should definitely give us energy We also packs in the
I have made significant progress on this project. I believe I have correctly implemented an FFT algorithm in my program. I have tested the out put using THIS sites data, and it seems to match the expected pattern, even though the exact values are not the same. The graphs being produced also look correct.
This first image is the original signal that I obtained from my Radio receiver. The long low signal is before the radio is switched on. This signal was obtained from background noise on the radio, I did not tune it. This is essentially a control signal, I have yet to test it with an actual radio signal containing data.
This next image is a graph of the Real Component of the Complex output from the FFT function.
The following is a graph of the Imaginary Component of the Complex output from the FFT function.
The final image obtained from actual real-world data is this image showing the magnitude of the Real and Imaginary components together. The magnitude is given by:
These next three graphs show the Real and Imaginary Components and the Magnitude of a Sine wave which I generated in code, for testing.
The next step is to generate a spectrogram for the FFT output data, as well as some additional graphs, and add some new features and bug fixes to the main program, such as the ability to save graphs as image files.
This week I concentrated exclusively on the Signal Recorder and Data Analyser program. It is mostly done, in concept at least, but the Fast Fourier Transform algorithm I am using is proving to be difficult to implement and test.
I spent some time on the data visualisation and graphing, which turned out to be surprisingly easy with Qt. I still need to add some new functions, most notably the ability to save graphs and sections of graphs as image or separate text files. Saving screen out put as an image file is something I have never done before.
I did find a suitable algorithm to use for FFT, on THIS site. I also tested it’s date with some date I found HERE. My values did not match up exactly, but the output pattern of the data and expected behaviour seemed to be the same.
I need to know the Sampling Rate for some of the FFT algorithms, so I had to do some further research and experimentation into Arduino-based datalogging. I determined that the maximum rate that the Arduino serial connection seems to be capable of logging data is 62.5 Hz, which is 62.5 times a second, or once every 0.016 milliseconds. This is reasonably fast, but not really spectacular. For the FFT program to work, the sample rate has to be a power of 2, which would mean that 32 Hz is the highest sample rate that I can use.
I also spent time working on the mathematics of FFT, and making sure my understanding of it was correct. I am reasonably sure that it is at this point, and I don’t have a lot more work to do on this part of the program.
I have been working on an idea recently to create a concept test of a Wireless Power system. This is basically what is sounds like, “beaming” power from a transmitter to a receiver with no wiring, no plug, etc etc. There are several commercial products using, or intending to use, this system, and it’s unlikely I will be able to come up with anything superior to those concepts, however I do this this is worth spending some time on.
A wireless power system could have many applications, but one which springs to my mind is nanorobotics. Our battery technology has always lagged behind, we are still using lead acid batteries, a concept with is hundred of years old. To miniturise a battery or a generator to the size of a nanite would be essentially impossible. However, by beaming power wirelessly to the nanite from an external transmitter, the nanite would need only a small antenna, no batteries, capacitors, power regulators, etc etc. This would be a huge step forward for the field.
Imagine, for example, the potential for improvements in medicine. A patient could sit inside a structure which would contain a coil. This would transmit the power to the nanites, which could be injected into their blood stream. Now, these nanites could be little more than an antenna for receiving power, some form of locomotion, some basic microcontroller, and some means to interact with the patients cells.
The nanites could be powered, programmed, and controlled externally, and then directed to wherever they needed to go. Once their work is done, they would be simply flushed out of the patient with no invasive procedures required at all. If some kind of pattern matching algorithm were developed, it could be possible for the nanites to, for example, differentiate between cancerous and non cancerous cells, and target only the cancerous ones, revolutionising treatment.
To create a simple concept test. The image below, captured from my oscilloscope, shows a proof of concept. The blue trace is the oscilloscopes probe calibration signal, which is transmitted to the receiver. The yellow trace is the output from the receiver. The peaks of the waves match up, and it is clear that the signal has been transmitted successfully, however there is a huge power drop. The received signal is not even enough to power an LED.
I think the kind of wire I used could be the reason for this. I used wire that was much thinner than the wire in the instructable. I am going to try again with new coils, which will be made smaller, and I may try some different capacitor values as well. I am confident that I can get this to work, I may just need to try several variations.
This week I added some new art assets to Artillery, just a fgew player controlled avatars. I am going to have either of them in the full game.
I spent most of my time working on my signal receiver and analyser. In addition to building my radio receiver and examining the signal on an oscilloscope, I digitised and saved the signal on my computer, and attempted to plot the waveform.I discovered that gnuPlot isn’t really suitable for the kind of data visualisation and analysis that I will be doing, and so I began writing my own solution. I decided to use Qt to do that, and I have a concept test of the program working very well. I still need to implement the signal analysis part of the project, but the visualisation part is going very well. I will probably release this software tool as well. It’s quite specialised, but I couldn’t find anything out there that did what this does, so maybe someone else will be in the same position.
Qt is an excellent library. It’s actually more than a library, it comes with its own IDE, Qt creator, which is very similiar to visual studio, which makes it easy to pick up. There are a lot of examples and tutorials available for Qt, and an active forum, which always makes it easier to use a language or a program. I can see a lot of potential here for future development, I will certainly be using this library again. It is far, far easier than MFC, which I used to use in C++. The complexity and, from what I could tell, convoluted and bloated nature of MFC really put me off gui development in C++, and I’m sure a lot of other developers felt the same. With Qt however, the power and performance of C++ can finally be combined with a simple easy to use graphics package.
Following on from my VLF antenna, I have decided to build a concept test of a Signal Recorder, Digitiser, and Data analyser. What this system will do is pick up a signal on a frequency or a series of frequencies, digitise that signal, store it, and provide the ability to display the signal to the user or perform functions such as Fast Fourier Transform analysis (FFT) or other analysis techniques on the signal, searching for patterns.
The general objective behind this is to come up with something that can be combined with a large antenna and a sensitive receiver to produce a homemade radio telescope. The software would discard “background” radiation and identify signals with an ordered pattern, which may originate from stellar objects such as Quasars, Pulsars, or Magnetars.
I have succeeded in building a small radio receiver using an arduino and a Phillips TEA5767 radio receiver to build a simple radio. It will only function in the commercial radio band, from between 87.5 to 108 MHZ. This is enough for me to develop and test my sampling program.
I have managed to capture detailed data from the radio, and I can see it in real time on a software-based oscilloscope, however, graphing the stored data is proving to be a problem. I am using a program called gnuPlot, but I have noticed that I can only plot a small number of data points before the graph becomes too cluttered to be usable. I have not found any other suitable graphing or plotting software which supports “scrolling” the graph, this seems to be an uncommon feature. There is also the issue to performing the data analysis.
So, I have decided to simply write the software that I need myself. I have decided to use the Qt library for C++ for the graphics. I have briefly used this before, but not in any depth, and I can see great potential in learning to use a package like this for future projects. Writing my own software will also allow me to integrate the FFT and other data analysis code with the graph, instead of having to separate them.
The problem is that I have a staggering amount of data to plot. Just a few seconds of data from my antenna results in 900,000 data points! This will obviously require some kind of optimisation technique in order to display the data properly. What I have decide to do is to read the entire data set (which is stored in a text file) into memory (assuming it will fit, if not, I will have to either use a database or split the data set into separate graphs) and then display the graph by plotting every, say, 100th point. So a 900,000 data point graph will be reduced to 9000 points, which is more reasonable.
I can then zoom in on a particular part of the graph, and display it in more detail, excluding the rest of the graph. Using data analysis, I can also highlight interesting points of the graph automatically, or remove any areas that don’t contain potentially useful information, reducing the data size considerably.
These are plots from a processing sketch displaying a trace from the radio. These were captured with the antenna disconnected, showing just back ground noise.
This is a plot captured with the antenna connected. At first glance, it may look the same, but if you look closely you can see a pattern in the data that is different from the background noise. This is a radio station that I was picking up with the antenna.
Finally, this is a gnuplot plot of the data that I captured and stored in a text file. It looks like an authentic reproduction of the orignal signal, but it is only a fraction of the size. Plotting the full dataset results in an illegible graph.
lettuce the palette
Mint & Lime
We also has spice and vitamin that’s a healthy but it’s not only will like
Tropi-Kale
This mint and each into your toxins with natural energy We appreciate that your toxins with new things and a great to lattes and Gorgeous
We’re back up in like cancer Leafy green smoothies here already The best greens in the… color! Seriously though spinach However if you feeling fresh juice recipe every day keeps the ‘Skin Smoother’ by the morning visit need a spiced juice two or glasses That’s it tastes that isn’t good for you feel great recipe and creamy texture and makes for the juicer your long fast
This exotic fruit brings their own unique healing abilities Spinach and overall health Not only healthy lunch or zing of beta-carotene which makes for reducing stress Sign us energy We also helps with acne or flu All the most delicious homemade juices that also has personality and easy You need a try
Healthy Juicing
I have decided to start doing weekly updates of all my current projects, instead of waiting until I have finished or made a major breakthrough to make a post.
This week I spent some time debugging Artillery! and I created an inventory system for it and created some new art assets and new projectile types, as well as adding support for up to four teams. I also did some work on the Gui’s for the game.
I have come up with a lot of new ideas for inventions and, I spent some time working on those too. I already posted on the holographic display, and I also have an idea for a wireless power system that I am playing around with. It is a very simple concept prototype so far. It uses the concept of resonant inductive coupling to transmit power over distance. I have always been interested in nanorobots, and one of the main problems with them is power. Miniturising batteries and power systems is far too complex for a machine that small, so a wireless power source would be essential. I will be making a dedicated post on this in the near future.
I finished the operational amplifier, and obtained a trace from the antenna, which I am now in the process of analysing. The size of the data set is making it difficult to visualise and process the data, but I am somewhat confident that I at least achieved proof of concept.
I am also working on a simple arduino-powered FM radio receiver, in an attempt to practice receving and digitising radio signals. I have a working prototype of the radio, I now need to capture the signal using the arduino and process it. This should be a similiar problem to the one I am having with the VLF antenna trace. I will be posting on this in more detail soon as well. The ultimate goal with my radio projects is to build some kind of simple but functional radio telescope, which could be used to pick up stellar phenomena. Whether this is possible or not remains to be seen.
I have finally finished phase one of my VLF Antenna Project. I am generally happy with the results, the antenna worked, and I did get some definite radio atmospheric activity from the audio amplifier. However, my attempts to digitise this data have not been very successful.
I attempted to use an Operational Amplifier (OpAmp) to replace the audio amplifier in the speaker, and I connected the output from the OpAmp circuit into the Arduino, but I am not confident that I captured real data coming from the Antenna. I have two large data sets that I am currently attempting to process. Most of the programs I have used can’t handle the large size of the dataset, however, small sections of the data that I have plotted look ok. I will continue my attempts to replicate the observed trace using the data I have saved.
I have been using gnuplot to plot the data, and it seems to be able to process it ok, but presents it as as squashed block of red lines. I need to figure out how to space it out more before I can make use of it.
I did see one bizarre signal while recording the trace, which lasted several seconds. It seemed to be some man-made signal however, it looked too ordered and consistent to be natural. It could have been a radio transmission from a boat or a plane, or something of that nature. I will analyse it further if I can isolate it from the data.
The signal output shown below is the normal background radiation picked up the the antenna, there is nothing particularly unusual going on there.
I have always wanted to create a “holodeck” or a completely immersive virtual reality environment. This is not yet possible with current technology, but various advancements have come close. The limiting factor in most cases in cost, however, I have discovered a simple method of creating a vert low cost 3D hologram.
Firstly, I need to define some terms. When people think of holograms, and 3D displays, they often don’t use the correct terminology. A 3D display usually generates two flat (2D) images which are slightly offset from each other. These displays usually use some form of glasses (Shutter glasses, coloured glasses, etc) to ensure that each eye is seeing only one of the two images. The brain then creates a 3D image by combining the two flat images. This is essentially how our brain creates real 3D images, each of our eyes sees the world slightly differently, and the brain determines depth information by combining the image from both eyes. This is, however, not what many people would call “true” 3D, in the sense that it “tricks” the brain into displaying a 3D image.
“Autostereoscopic” refers to a system which does not requre any kind of glasses or external hardware. This is something I find is important, since a lot of systems (particularly those which use shutter glasses) cause headaches, and some systems may require precise viewing angles.
To create a true 3D image you need a “volumetric” display. These are, as the name suggests, displays with volume. They do not use stereoscopy to fool your brain into thinking it is seeing a 3D image, they actually create a 3D image. The simplest type of volumetric display are the “LED Cube” projects that you often see on youtube and on hobbyist electronic sites. Basically, this is a large number of LED’s arranged into a 3D cube and and by changing the colour, or turning th LED’s on or off, it is possible to create a crude image. This is fine for demonstrations, or for art projects, but for actually practical purposes, this approach is not suitable, and there is a very simple reason why. The lowest resolution that would be “useful”, I feel, would be 51 2x 512 pixels. Even this is very small by today’s standards, it’s been a very long time since game sor other graphics programs ran in that resolution, but to make a 3D LED cube would require 512 LEDS, multiplied by 512 LEDS, multiplied by 512 LEDs. This equals: 134,217,728. That’s over one hundred and thirty four MILLION LED’s!!! If each LED is an RGB LED, allowing for a colour display, then multiple that number by four. That is an awful lot of soldering!!! Something like this then, could only be done by a professional manufacturing process, not by a hobbyist.
The second problem with this kind of technique is the difficulty in rendering data to it. You must create your own driver to control which LED’s are on and which are off, and what colour they should be. This is non-trivial.
Other forms of volumetric display technology are in the pipeline, including plasma displays (an infrared laser is used to heat up the air at a precise point, which turns to a plasma, producing a visible point of light) and rotating/moving displays. The moving displays have had some success, and are probably the best type of volumetric technology available. Basically, instead of making a 3D display, you make a flat plane, and rotate it quickly, relying on the persistence of vision effect to produce what looks like a 3D image. Some would say this involves some “trickery” like the stereoscopic display, but it allows you effectively remove a dimension, so if creating a display using LED’s, a 512×512 display is now 262,144 LED’s. This is still impractical, but less so. Rotating displays are even more difficult to create from a programming point of view however, since not only do you have to figure out how to render the image in 3D, you also have to precisely calibrate the image rendering with the rotation of the display panel, which requires split-second timing.
I think I have discovered the best way to produce a large, 3D, holographic display, possibly with volumetric features. There are several products on the market which adertise themselves as “Holo Pyramids” or “3D pyramids”. These range from a device small enough to be used with the screen of a smartphone as the image source, to a device which uses a TV or computer monitor as the light source, and even some much larger models which use projectors as the light source. All of these products use a phenomenon called “Peppers Ghost” to produce a 3D image which appears to hover in mid-air.
The above graphic explains the concept. A projector (bottom of graphic) is hidden below a semi-transprent screen tilted at a 45 degree angle. The light from the projector hits the scren and is reflected towards the observer (red line). The observer perceives the image to be “floating” in the air in front of the screen.
The above picture is my very rough idea for a 3D hologram generator. This is similiar to the aforementioned “hologram pyramids” that you can buy, with some modifications which I will come to in a moment. The basic mode of operation is that the Screen (which is normally a flat screen computer montor or TV) projects an image down onto a perspex or polycarbonate pyramid, the walls of which are at an angle of 45 degrees. The reflection of the light from the screen create the appearance of the object on the screen being in the center of the pyramid, seemingly floating, and with the appearance of depth. This can be quite a strong effect, there are many references to it on the internet. In order to produce the effect, the monitor must display four images, one for each panel of the pyramid. These images are then reflected onto the panels and combine to form the 3D image.
The inside of the perspex or glass pyramid is usually coated with some kind of tinting material, similiar to the material used to tint car windows. This is done to reduce the effects of secondary reflection within the pyramid struction, which disrupts the 3D effect. Too much tinting however will make the 3D object very difficult to see. Using a projector instead of a screen may also cause this problem, and it will be important to source a projector capable of high brightness.
I have made two changes from this basic concept. The first change is that instead of using a bulky, expensive monitor, I intend to use a projector. This will be cheaper (basic projectors cost less than €50 on eBay) more compact, and will be able to produce a much larger image than a computer monitor. Projecting the image onto the screen may be tricky, I would most likely make the screen thin enough the the image from the projector can be seen on both sides, mount the projector above it shining down onto it, and then mirror the projected image. The projector and screen assembly would likely be hidden from view, so this would not be noticed.
The next thing I intend to do is quite clever. With conventional 3D pyramids, you only get the illusion of 3D. Since each panel of the pyramid is displaying the same image, walking around the display will not change the image. However, what if, instead of displaying an identical image on each panel, I display a different one? So that each image reflects a different “view” of the object? I think this will produce a much more accurate 3d representation of the object. This is similiar to what I am trying to build:
This system (built by ViTech) uses four projectors, so obviously they have used a separate projector for each panel of the pyramid. This would likely produce a much higher quality resultant image. It is not clear if each of the images is different, however, this effect would be difficult to achieve.
Almost all movies, computer games, etc has only one “viewport”. To render this image from a different angle would require access to the raw data or the source code of the object to be rendered. This is not always possible. Thankfully, I will be rendering 3d models and scenes from games of my own creation, which means I will have source code access. This means I can create 4 cameras in the scene, offset and rotate them correctly, and render away to some texture, and then send this texture to the projector. In practice this may not be so simple, but the concept is sound.