
P-115 Signal Recorder and Data Analyser: Fast Fourier Transform Implementation
I have made significant progress on this project. I believe I have correctly implemented an FFT algorithm in my program. I have tested the out put using THIS sites data, and it seems to match the expected pattern, even though the exact values are not the same. The graphs being produced also look correct.
This first image is the original signal that I obtained from my Radio receiver. The long low signal is before the radio is switched on. This signal was obtained from background noise on the radio, I did not tune it. This is essentially a control signal, I have yet to test it with an actual radio signal containing data.

This next image is a graph of the Real Component of the Complex output from the FFT function.

The following is a graph of the Imaginary Component of the Complex output from the FFT function.

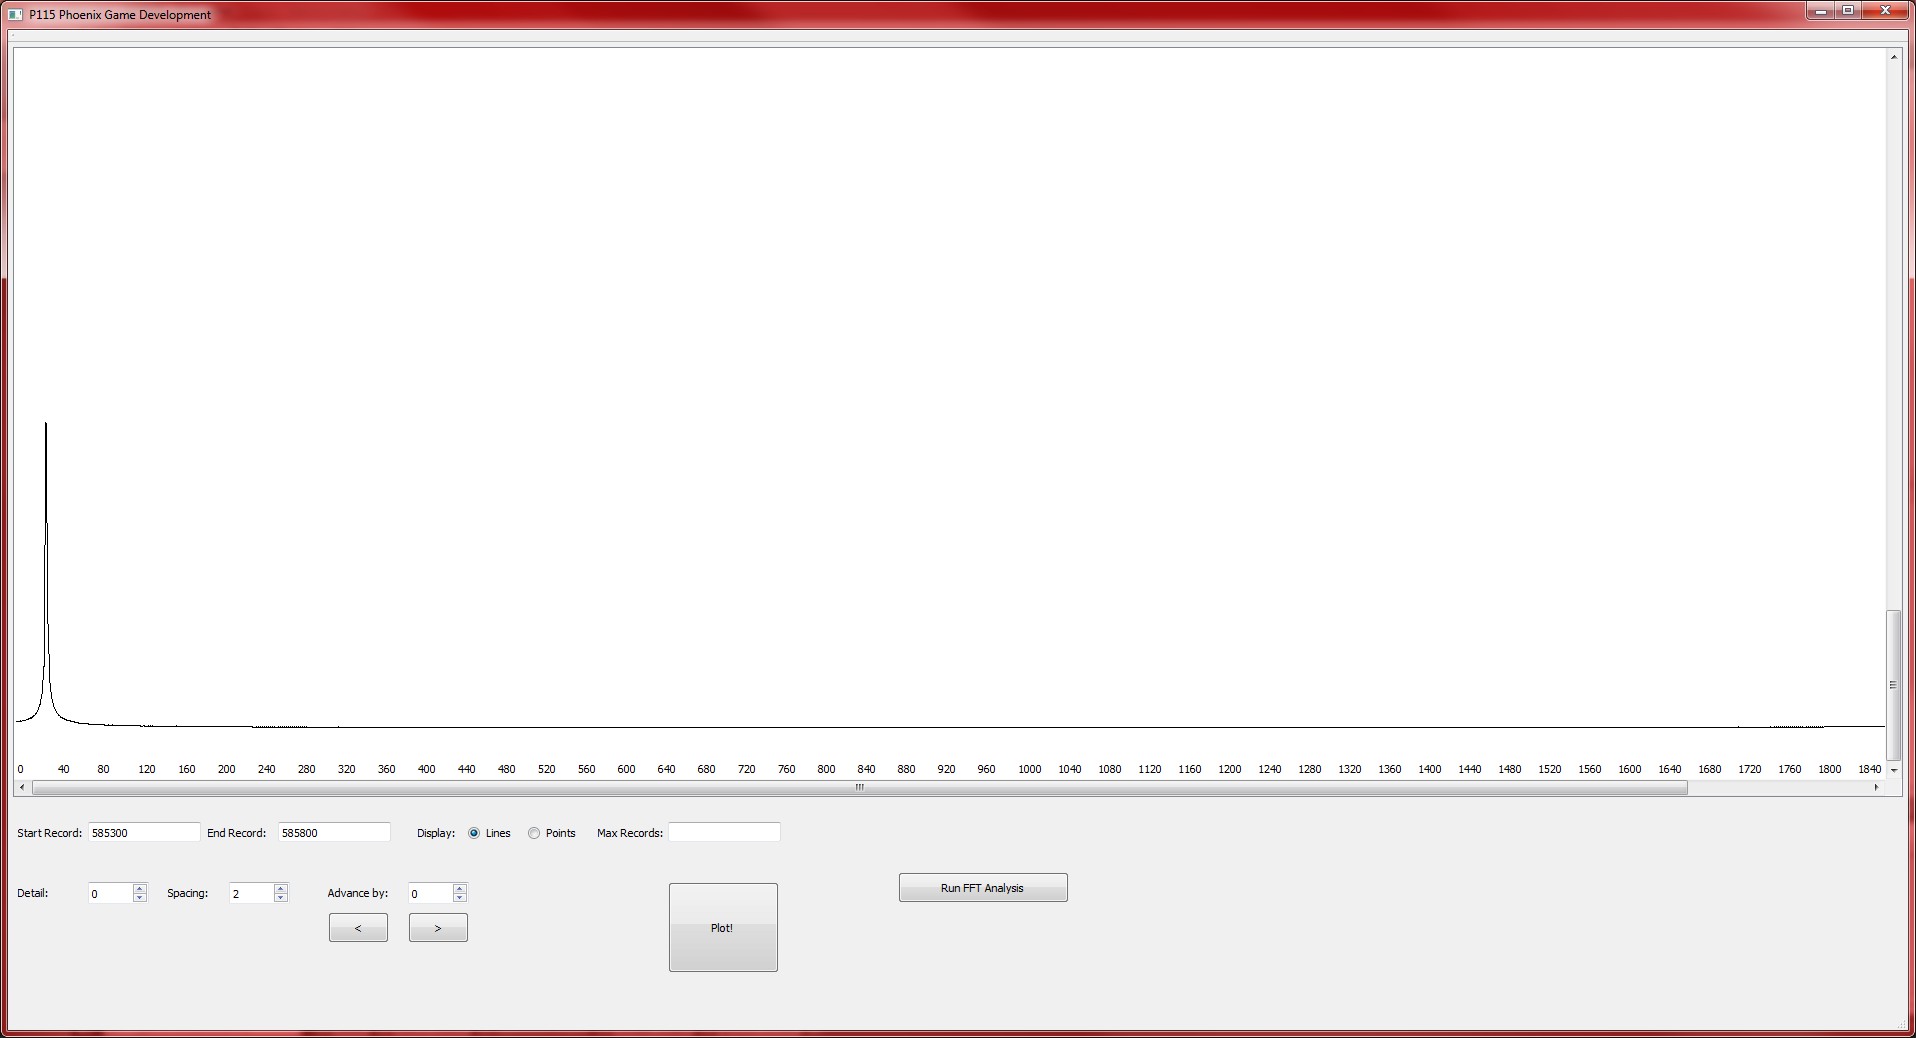
The final image obtained from actual real-world data is this image showing the magnitude of the Real and Imaginary components together. The magnitude is given by:


These next three graphs show the Real and Imaginary Components and the Magnitude of a Sine wave which I generated in code, for testing.


The next step is to generate a spectrogram for the FFT output data, as well as some additional graphs, and add some new features and bug fixes to the main program, such as the ability to save graphs as image files.


