I have made significant progress with the Icarus rocket simulator, I now have gravity, rocket staging, and time compression done. I have also begun adding the ability for the program to export space-delimited raw data files for loading in spreadsheet programs like open office. One of the additional variables I am now modelling is the ability to determine the dynamic pressure on a spacecraft at any given time, and from that, to determine the "Max Q" or the maximum dynamic pressure sustained by the craft during it's flight. This is working very well, and the number I am getting match real-world values. In addition to the mission log, which is a text dump of all of the velocity, altitude, pressure, and fuel data per tick, and the rocket data file, which contains all of the data needed to create and load a rocket into the simulator, Icarus is an excellent simulation and visualisation tool, much more than just a game.
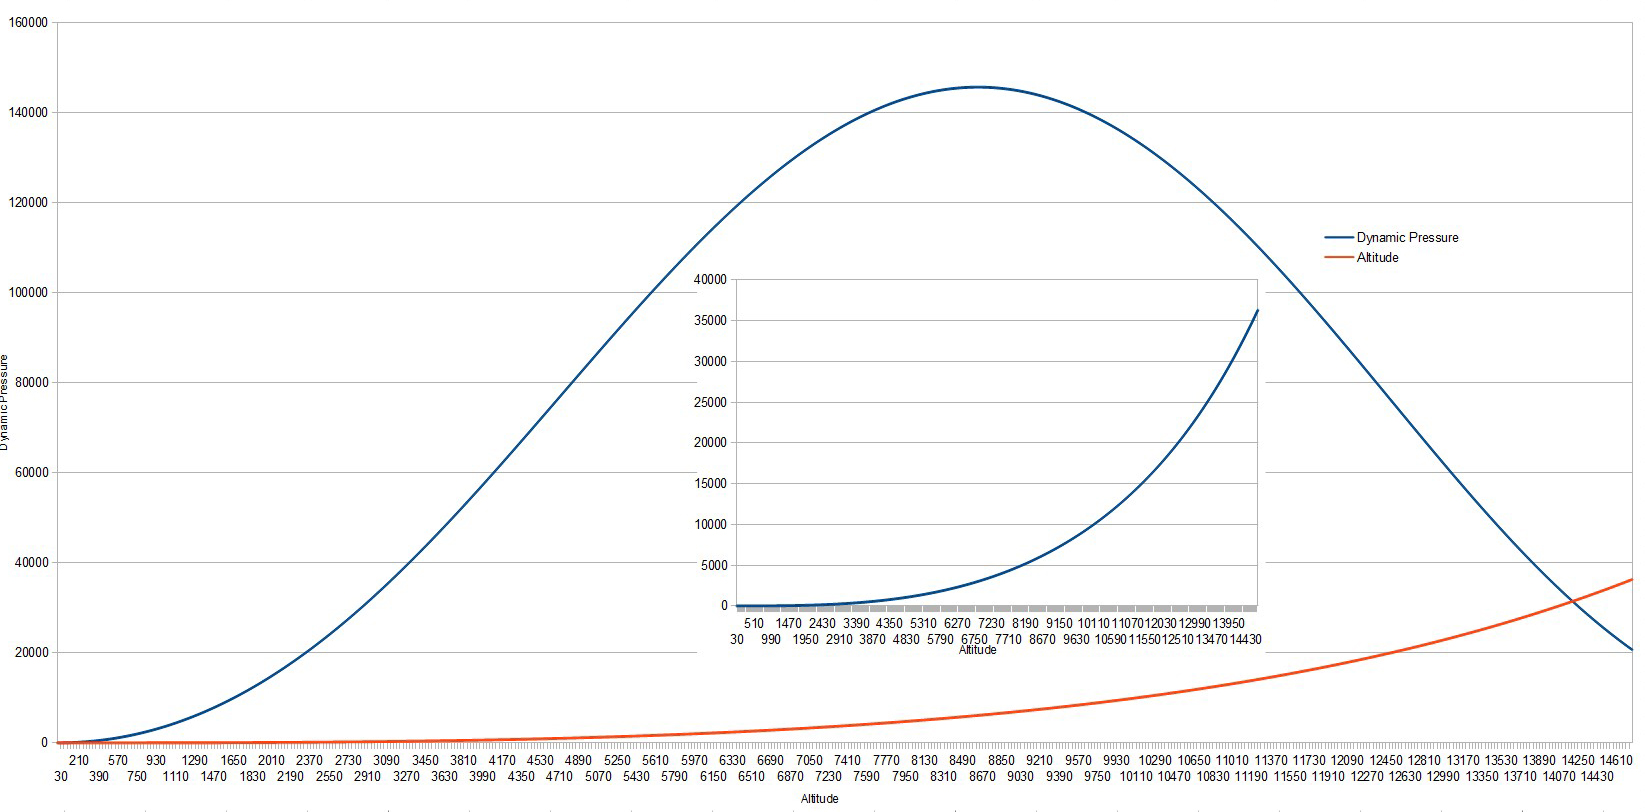
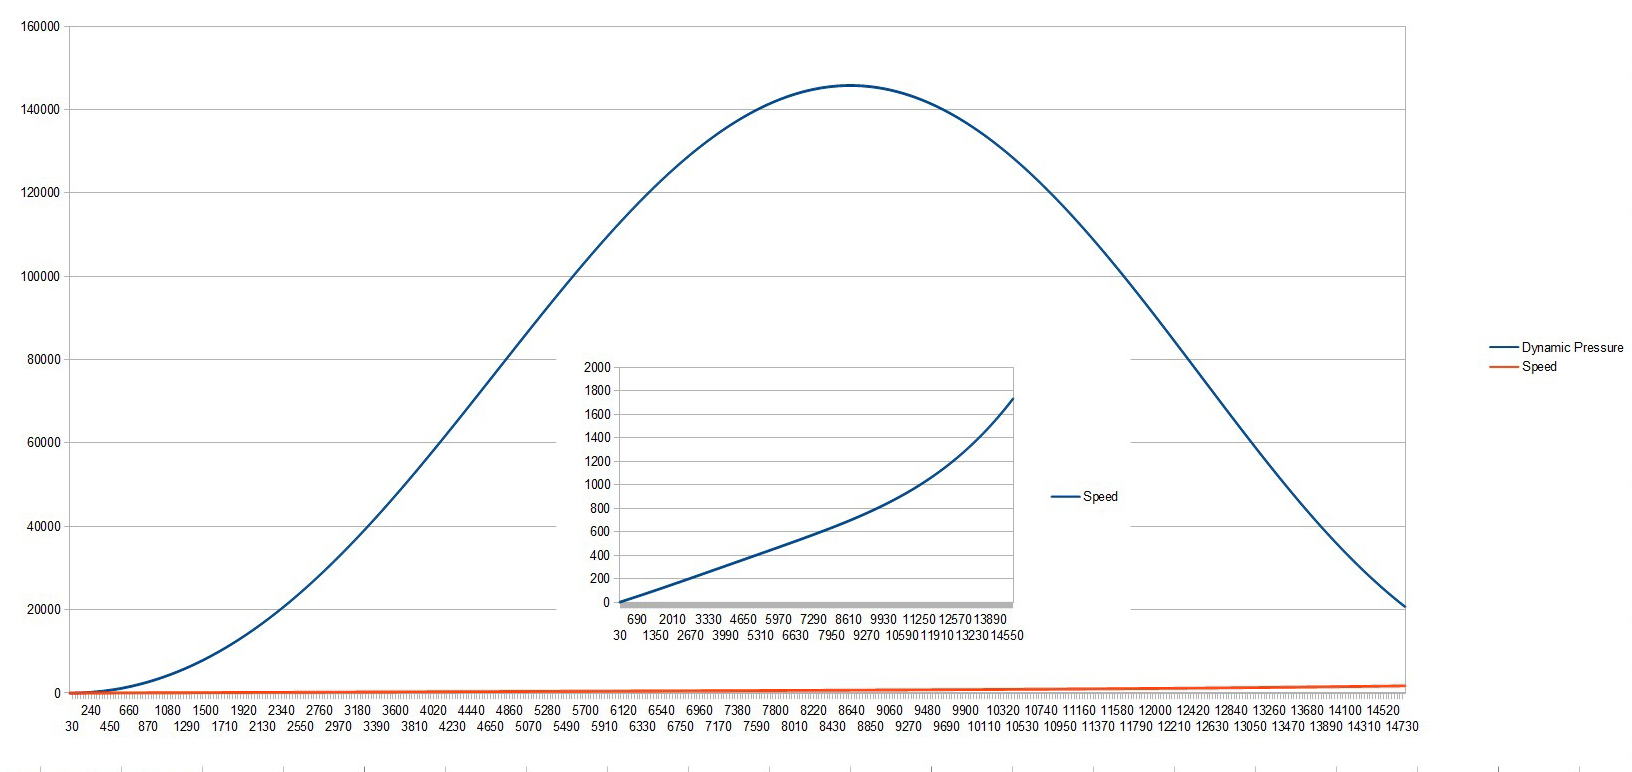
However, there is a problem. As well as designing the simulator program, I am also designing a rocket. The Max-Q of the Saturn 5 rockets used in the Apollo program was about 33,599 pascals. The rocket that I am designing is currently showing dynamic pressures into the hundreds of thouands of pascals. This kind of pressure would easily overstress the airframe and completely destroy the rocket. The problem, as the graphs below will show, is that the rocket is accelerating way too fast, however, if I throttle down the rocket any more than it already is, it won't have enough thrust to get off the ground.
I have put in the ability to throttle the engines, and I am now going to have to figure out how much to reduce the throttle in the max-q region to bring the aerodynamic stresses down to reasonable levels.
The graphs below show Dynamic pressure with respect to altitude, and dynamic pressure with respect to speed. The small graph in the middle of the larger graph displays altitude and speed on their own for their respective graphs.
The finished program will have the ability to export data related to speed, altitude, dynamic pressure, fuel flow rates, fuel quantities, etc etc, allowing for a very detailed analysis of a mission. I will also have the ability to create a "Thrust Curve", a graph showing engine thrust with respect to time, often used with solid fuel rocket motors to judge their performance.
As an aside, wikipedia didn't have an entry on "Thrust Curve" so I added one myself: Thrust Curve